The Mathematical Illusion of “Aiming Higher”: Why China’s Sub-5% Growth is a Structural Certainty

The Economist recently published a critique of the Chinese government’s 2026 Government Work Report, arguing that policymakers are “dangerously rooted in the past” and that the GDP growth target of 4.5%–5% lacks ambition.
While the sentiment makes for compelling financial journalism, it fundamentally ignores the mathematical and macroeconomic realities of the current decade. The critique misses the forest for the cyclical trees. We will never again witness the 10% macroeconomic surges of the past; the long-term reality for China is a sub-5% growth rate.
To understand why “aiming higher” via mere policy ambition is a statistical illusion, we must look at the hard data mapping the intersection of demographics and economic output.
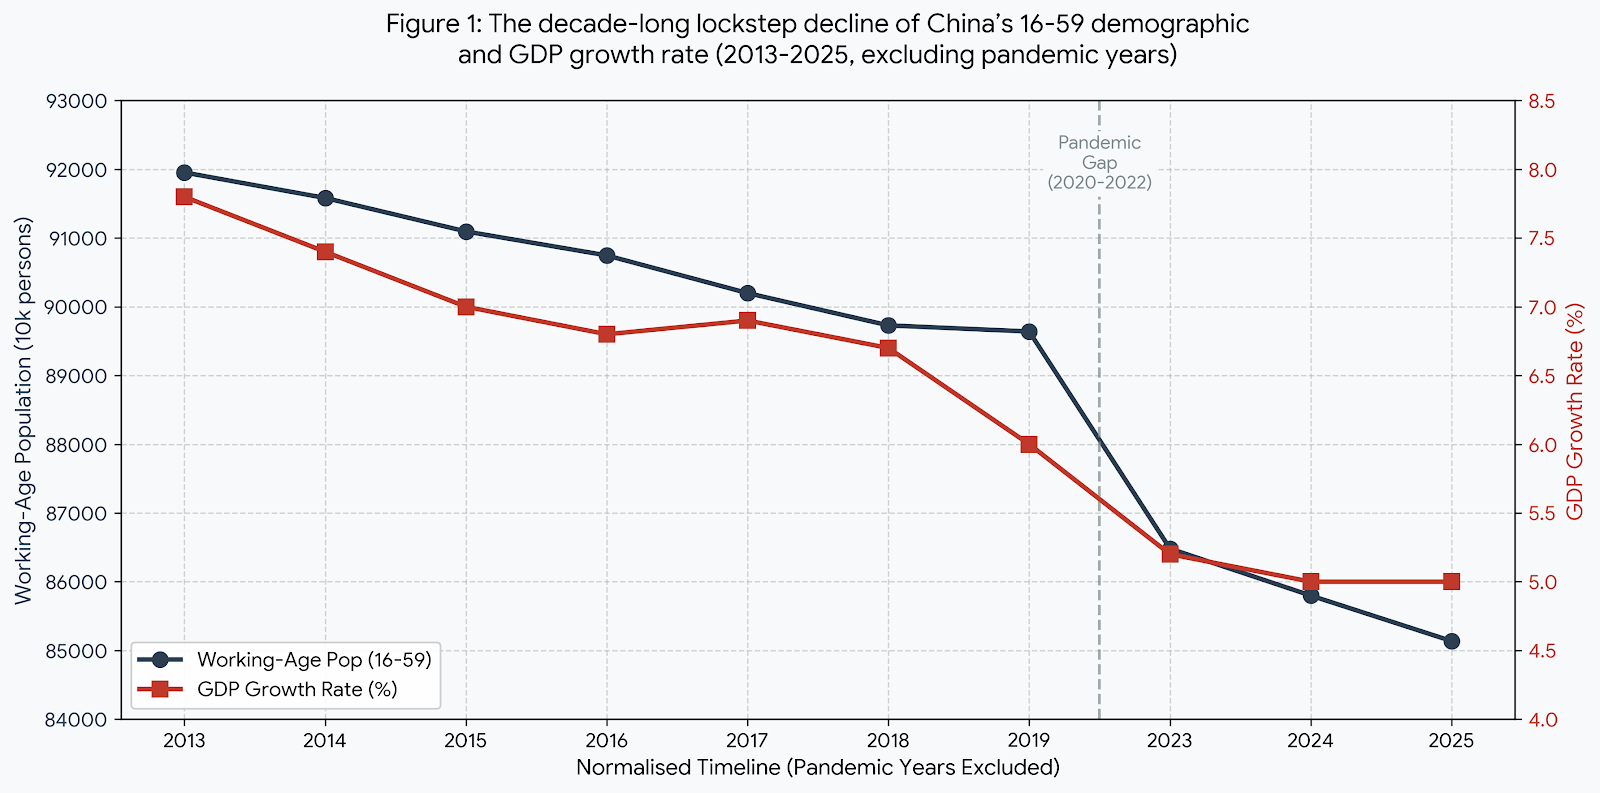
The Raw Data: A Decade of Normalised Growth (2013–2025)
To uncover the true underlying structural trend—the “grey rhino”—we must filter out the severe noise of the pandemic years (2020–2022). This leaves us with exactly 10 years of normalised economic operation.
| Year | Working-Age Population (16-59) (10k persons) | GDP Growth Rate (%) |
|---|---|---|
| 2025 | 85,136 | 5.0 |
| 2024 | 85,798 | 5.0 |
| 2023 | 86,481 | 5.2 |
| 2019 | 89,640 | 6.0 |
| 2018 | 89,729 | 6.7 |
| 2017 | 90,199 | 6.9 |
| 2016 | 90,747 | 6.8 |
| 2015 | 91,096 | 7.0 |
| 2014 | 91,583 | 7.4 |
| 2013 | 91,954 | 7.8 |
(Source: National Bureau of Statistics of China.)
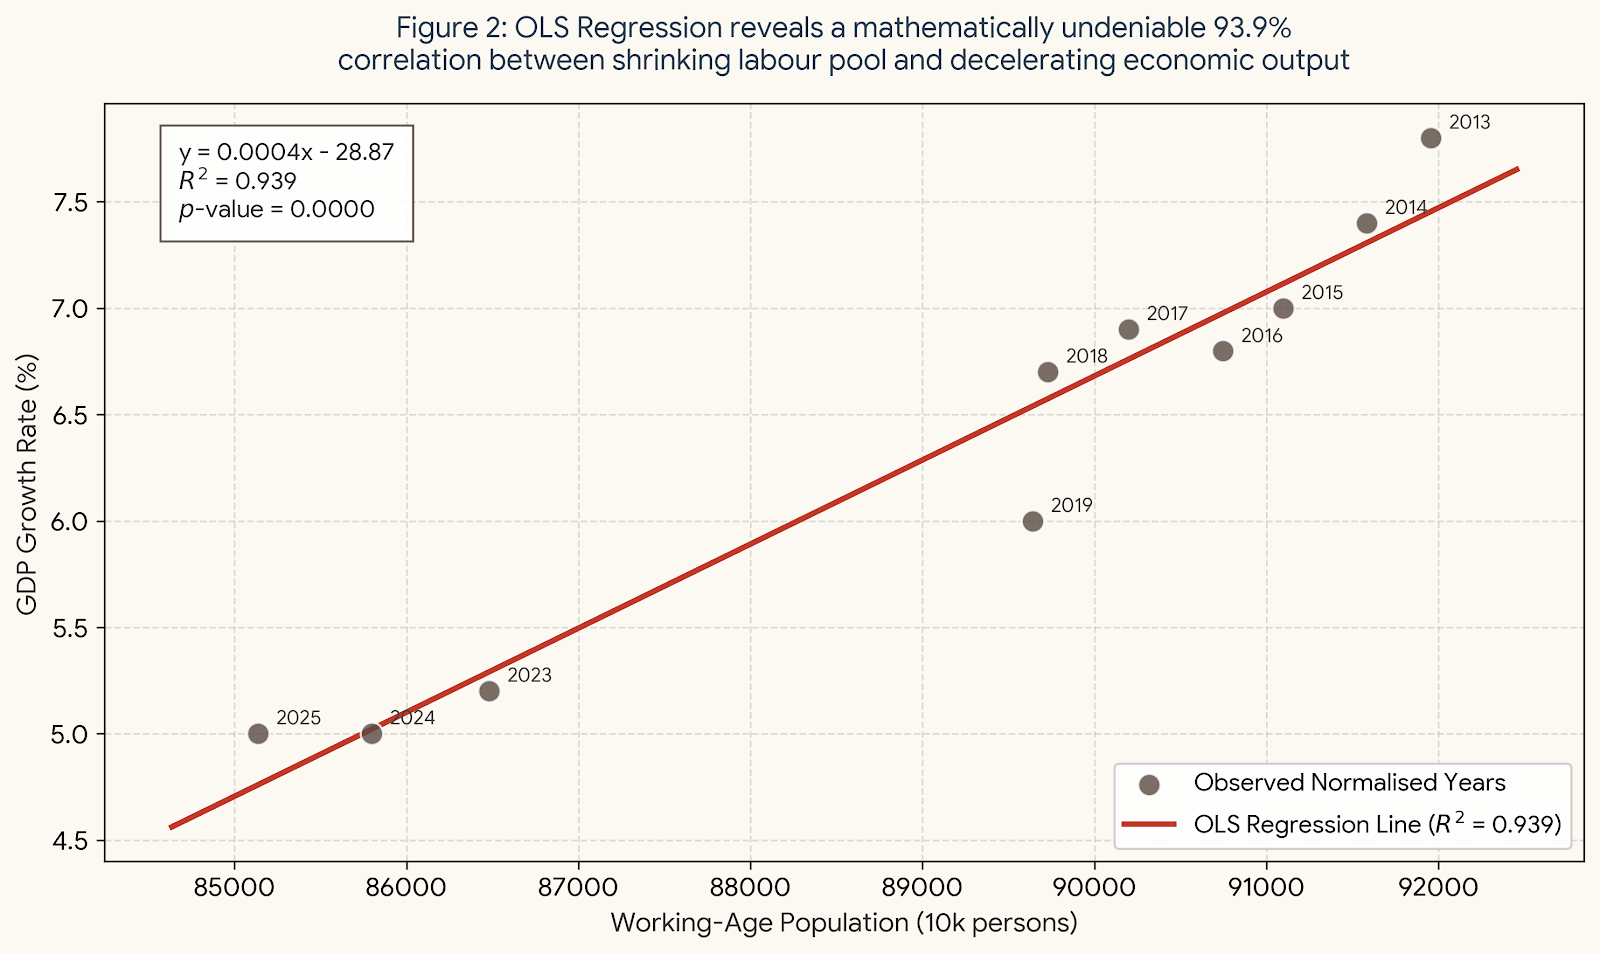
The Statistical Proof: The 93.9% Correlation
To prove that the decline in GDP growth is a structural inevitability rather than a lack of policy vigour, we apply a rigorous Pearson correlation and Ordinary Least Squares (OLS) regression analysis to the 10-year dataset above.
1. The Pearson Correlation Coefficient ($r$)
Let $X$ represent the Working-Age Population and $Y$ represent the GDP Growth Rate. The formula is:
- Mean of $X$ ($\bar{X}$): 89,236.3
- Mean of $Y$ ($\bar{Y}$): 6.38
- Calculated $r$: 0.969
This yields a near-perfect positive correlation. As the labour pool shrinks, the GDP growth rate follows in absolute lockstep.
2. Ordinary Least Squares (OLS) Regression
To quantify the exact weight of this demographic drag, we calculate the OLS regression line ($Y=\alpha+\beta X$):
- Slope ($\beta$): $\frac{\sum(X-\bar{X})(Y-\bar{Y})}{\sum(X-\bar{X})^2}\approx 0.0004$
- Intercept ($\alpha$): $\bar{Y}-\beta\bar{X}\approx -28.87$
The Regression Equation:
- R-squared ($R^2$): 0.939
- The Verdict: An astounding 93.9% of the variance in China’s slowing GDP growth over these normal operational years is explained by a single variable: the shrinking working-age population. The coefficient ($0.0004$) indicates that for every 10 million workers exiting the labour pool, the baseline macroeconomic growth potential drops by roughly 0.4 percentage points. You cannot legislate your way out of a disappearing workforce.
The Economic Theory Validation
This statistical phenomenon is perfectly anchored in classical macroeconomics.
1. The Cobb-Douglas Production Function
The standard production function defines output ($Y$) based on Total Factor Productivity ($A$), Capital ($K$), and Labour ($L$):
When converted into the Growth Accounting Equation:
Since 2013, the labour growth rate $\frac{\Delta L}{L}$ has been firmly negative. This mathematical term has shifted from being the primary engine of the Chinese economic miracle to a severe structural drag.
2. The Solow Growth Model
Looking at the Solow Model’s capital accumulation equation:
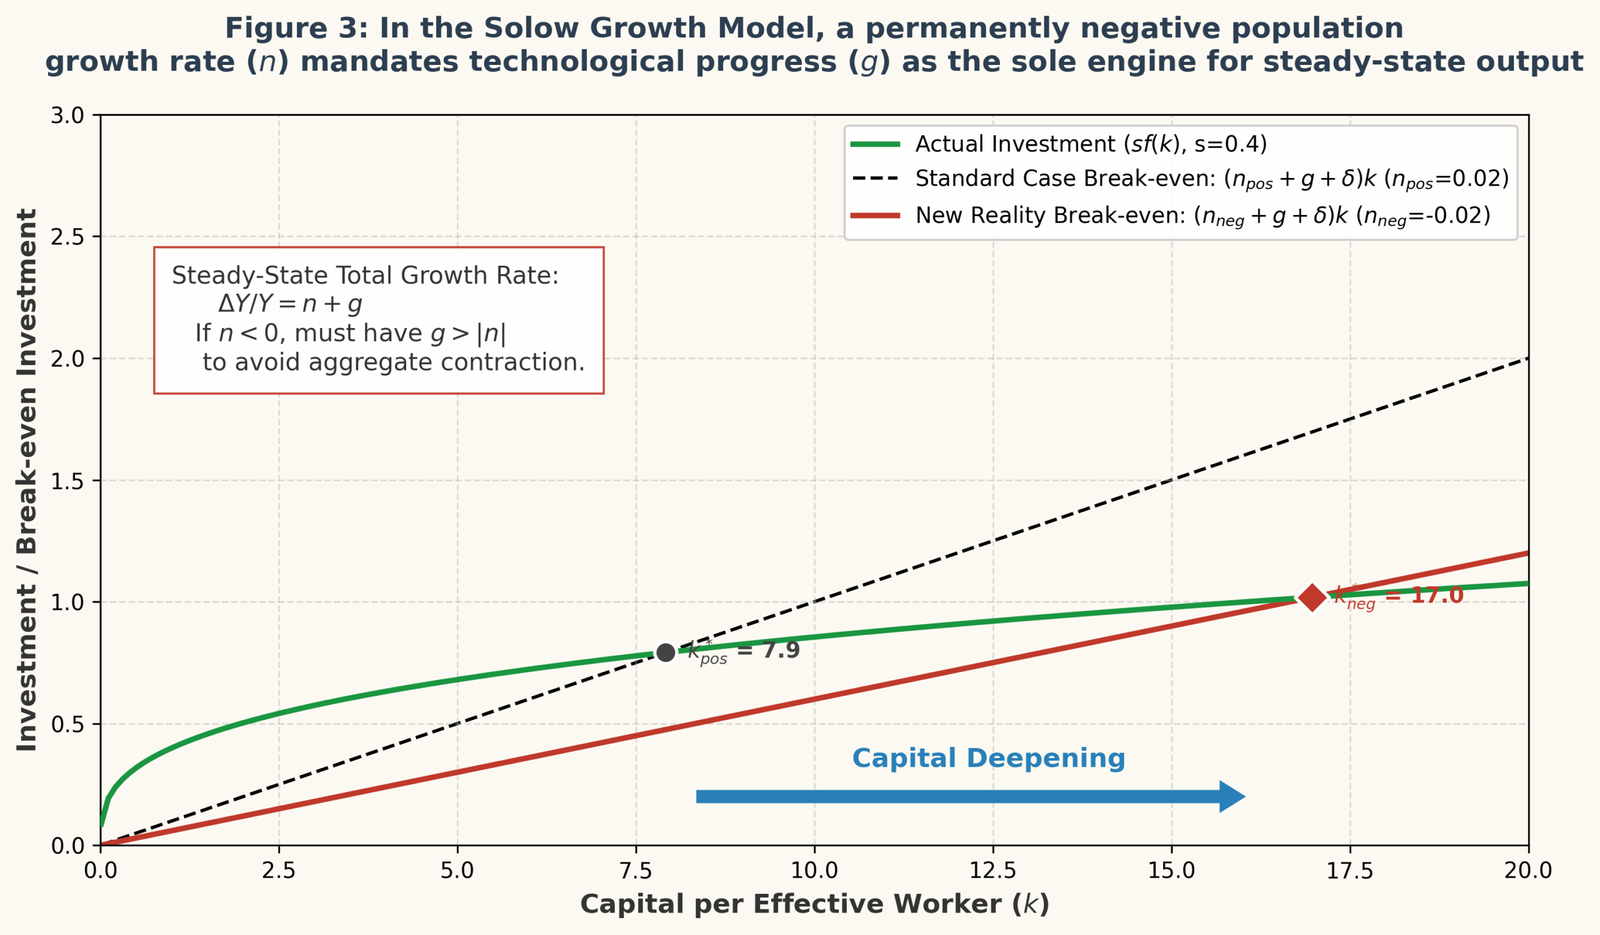
When the population growth rate ($n$) becomes permanently negative, the demographic beta vanishes. A mature economy can only avoid secular stagnation and achieve steady-state output growth through technological progress ($g$).
The Alpha Curve: Automating the Future
The irony of The Economist’s critique is that the very robotic arm they featured in their article is not a symbol of an economy failing to “aim high”; it is the exact, necessary macroeconomic response to the mathematical realities outlined above.
When $L$ vanishes, replacing it with intelligent capital ($K$ augmented by $A$) is the only viable survival strategy. The era of generating returns through raw demographic expansion is permanently over. True value—the alpha—is now found exclusively in identifying the technological chokepoints within AI, robotics, and future mobility that will drive the $A$ variable in the production function. This structural transition is the very essence of The Alpha Curve investment framework developed by myself, and it highlights exactly why I am tracking the global humanoid robot race and supply chain sovereignty.
Policymakers setting a 4.5%–5% target are not lacking ambition; they are practising mathematical realism. As the working-age population continues its slide toward 800 million by the 2030s, the “natural” growth rate will likely settle well below 5%. The hyper-growth era is behind us, and the race to automate the future has begun.